No-Bullshit Sales Reporting with HubSpot
Sales reporting in HubSpot without the wall of charts: what to track, why it matters, and how to ship dashboards your GTM team actually uses.
1) Why sales reporting matters right now
A good reporting stack answers three questions on one page: Where are we? Why? What’s next? Use it to coach, forecast, and course-correct fast—without turning reps into part-time data clerks.
In plain English
- Clarity: Trends, win rate, stuck stages, plan vs. actual.
- Decisions: Identify channels that convert; decide where to add headcount or what to stop.
- Forecast: A defendable view tying activity and pipeline to revenue.
2) Keep the object model tight (and strict)
HubSpot gives you the raw material: Companies, Contacts, Deals, Activities (emails, calls, meetings), Tasks, Products/Quotes. Keep associations and ownership clean so reports roll up without manual patchwork.
Do this
- One pipeline per motion; use views/filters for segments.
- Every deal needs owner, amount, close date, next step, company, primary contact.
- Auto-log email/calendar/CTI—no diary-style CRM.
3) Model the journey as a Bow-Tie (not a straight funnel)
Revenue doesn’t end at “Closed Won.” Make reporting reflect Acquisition → Onboarding → Adoption → Expansion, with conversion rates (CR1–CR8) and cycle times (Δt1–Δt8). This lets Sales, CS, and Marketing speak one language from MQL to LTV.
Bullet points to implement
- Define pre-sale CRs (Awareness→Education→Selection→Commit) and post-sale CRs (Onboarding→Adoption→Expansion).
- Track Δt per transition to spot bottlenecks and coach the motion, not just the rep.
4) Role-based dashboards (one screen per seat to win the week)
SDR/BDR – Create pipeline on purpose
- Calls, emails, meetings, follow-ups due, lead-queue health.
- Use it in daily stand-ups; fix where replies stall; coach sequences.
AE – Progress that predicts revenue
- Stage movement, win rate, median cycle, next steps coverage, slipped close dates.
- Deal reviews enforce stage exit criteria and unblock momentum.
CS – Retention that compounds growth
- Onboarding status, adoption signals, expansion pipeline, churn risk cohort.
- Weekly health checks trigger playbooks for risk/upsell.
5) Data quality first (or your charts lie)
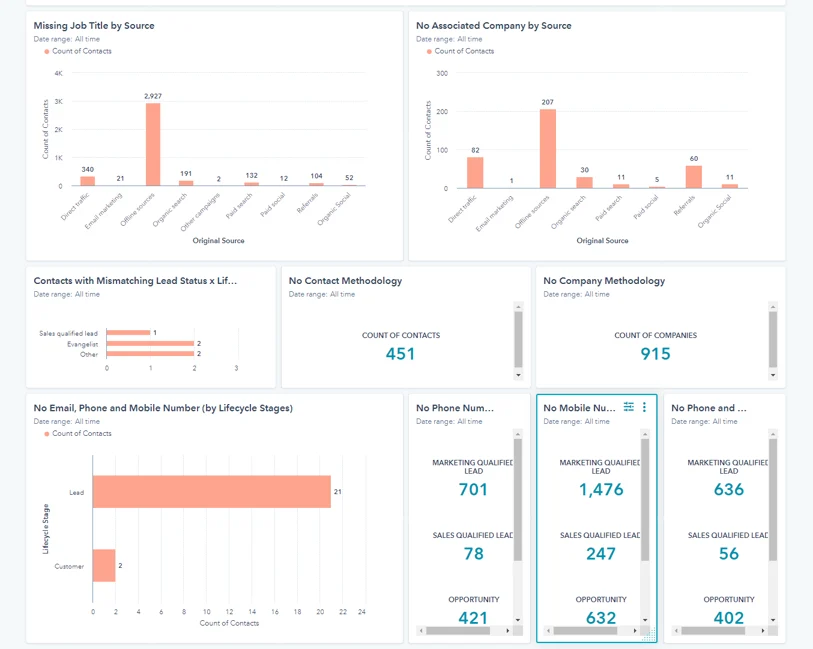
A Sales Data Quality dashboard keeps everyone honest: over-due deals, no next activity, ownerless deals, missing amount, deals without company/contact, too many close-date changes. Send it weekly; celebrate the cleanest reps; coach the outliers.
Add two guardrails
- Mandatory properties to advance a stage (configured in pipeline settings).
- Automatic reminders (tasks on “re-engage in 6 months” etc.).
6) Forecasting that stands up in a QBR
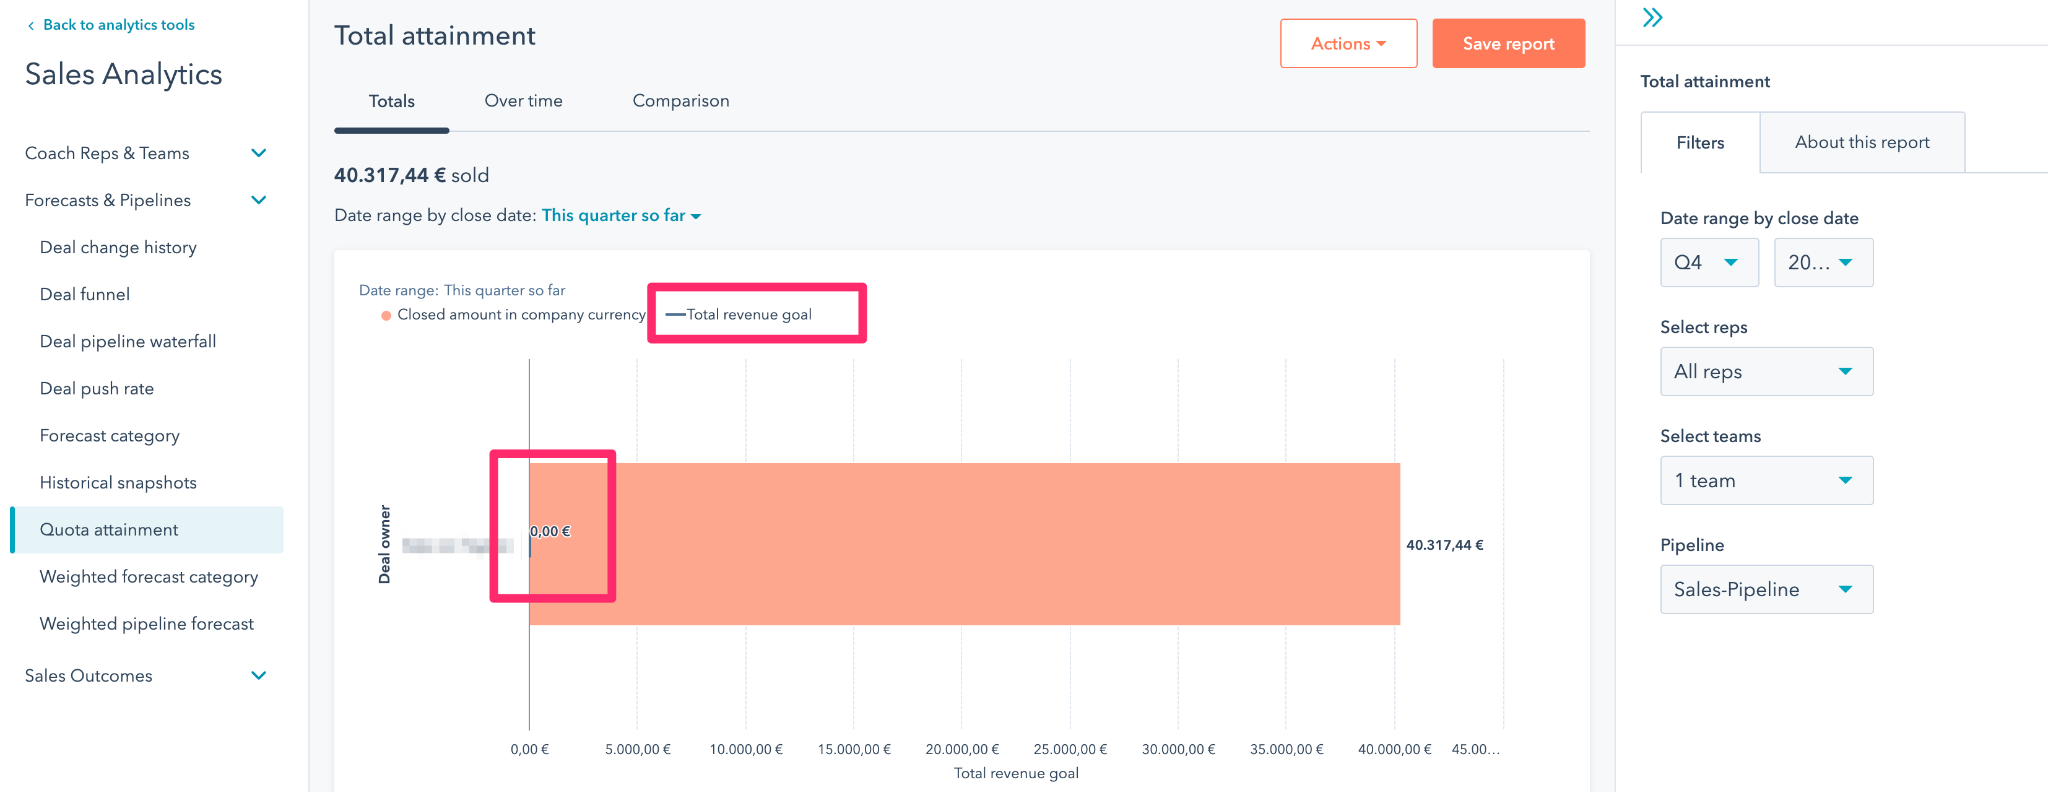
Pair HubSpot’s forecast tool with clean stages and realistic goals: weighted pipeline by stage probabilities, win-rate trends to stress-test targets, and ARR/MRR tracking against quota. Review weekly: what moved, what slipped, what died—anchored in next actions.
Quick setup
- Enable HubSpot Forecast, define categories, and align stage probabilities.
- Add coverage views (commit/upside) and commentary fields on risks.
7) The 20 reports that actually move the needle
Don’t drown in widgets. Ship the essentials grouped by job-to-be-done, then iterate.
- Pipeline clarity: Stage distribution, weighted pipeline vs. quota, stage aging, won vs. lost by reason.
- Funnel & source: Lead→MQL→SQL, MQL→SQL by source/campaign, new deals per week, average deal size (new vs. existing).
- Activity & meetings: Calls, emails, meetings per rep; meeting-set rate; activities per won deal.
- Revenue & retention: Revenue by close date, new vs. expansion, churn rate, upsell opportunities.
- Hygiene & risk: Deals with no next activity, overdue close dates, ownerless/missing-data deals, cumulative close-date changes.
8) From slides to system: a 10-step rollout
Blend narrative (why) with checklists (how). Move fast, then harden.
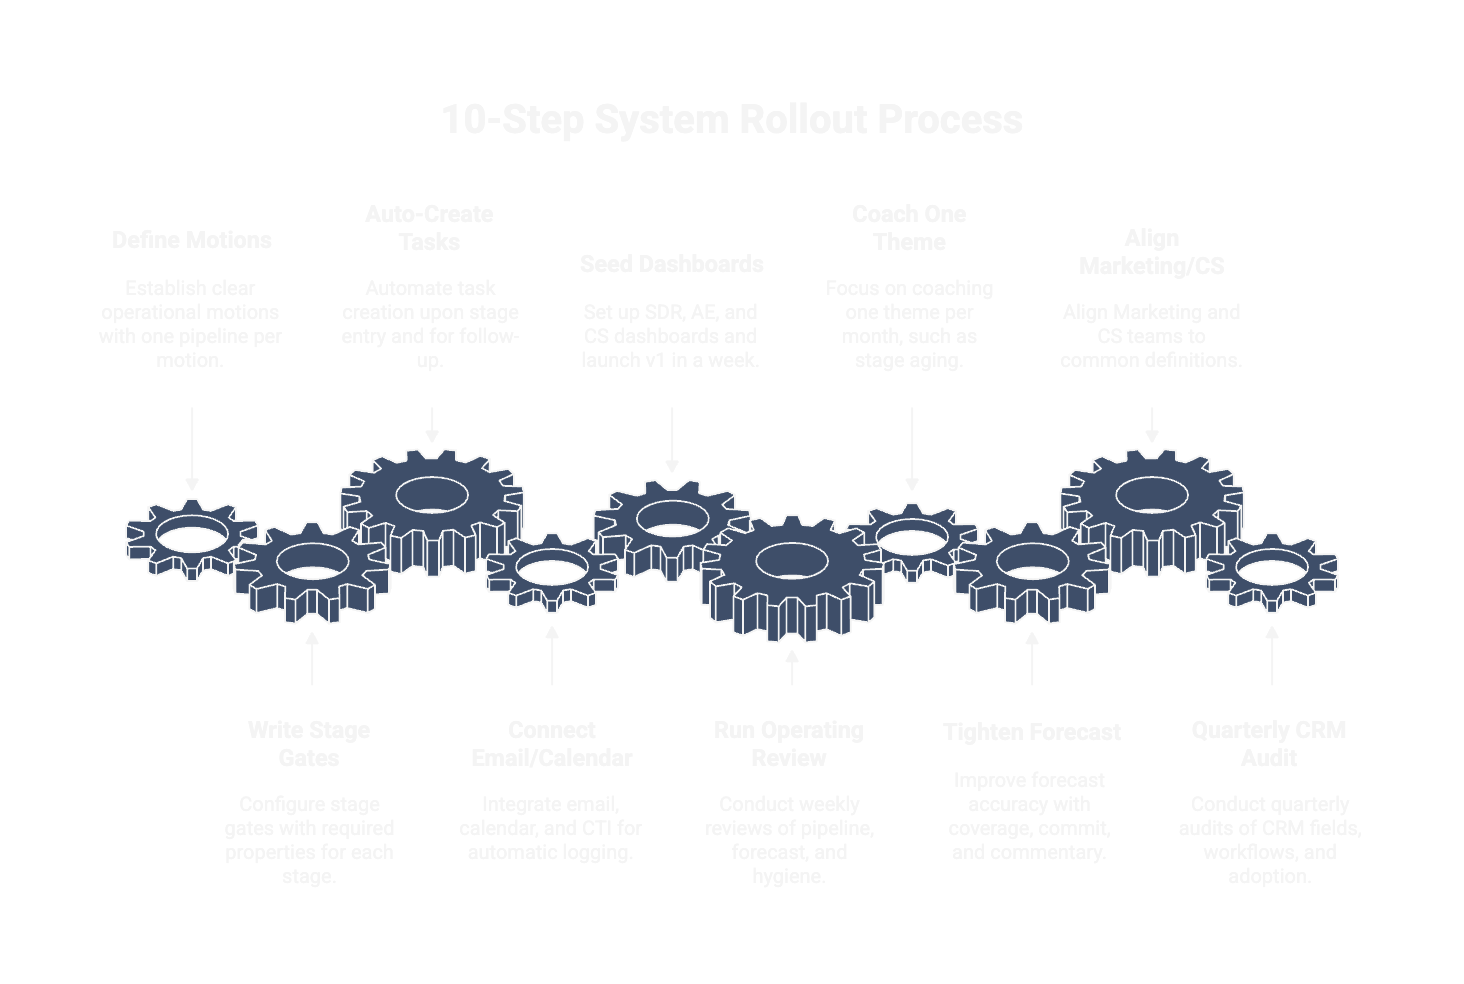
- Define motions; keep one pipeline per motion.
- Write stage gates; configure required properties.
- Auto-create tasks on stage entry and “re-engage later.”
- Connect email/calendar/CTI for auto-logging.
- Seed SDR/AE/CS dashboards; ship v1 in a week.
- Run a weekly operating review (pipeline, forecast, hygiene).
- Coach one theme per month (e.g., stage aging).
- Tighten the forecast: coverage, commit, commentary.
- Align Marketing/CS to the same bow-tie definitions.
- Quarterly CRM audit: fields, workflows, adoption; remove noise.
Frequently asked questions
1) Do we really need separate dashboards for SDR, AE, and CS?
2) What minimum fields should be mandatory at stage changes?
3) How do we keep data quality from slipping after go-live?
4) Weighted pipeline vs. forecast categories—what’s better?
5) How many reports are “enough”?
A free 60-minute Launchpad clarifies which lever should move first. No pitch, honest fit / no-fit answer and a clear next step.